Which part of the English coast has the cleanest bathing water? The South West, measured by the share of bathing waters the Environment Agency (EA) rated Excellent in 2025. The North West comes bottom. We ranked every region on that measure, then looked at how each has changed since 2015.
How the table works
- Latest year: 2025. We used the EA's official classification for every open bathing water in the TidalWaiv data. All 449 open sites have a 2025 rating. Nationally, 297 were Excellent (66%), 95 Good, 25 Sufficient and 32 Poor.
- Regions follow the TidalWaiv data API. The API files eight inland sites, mostly rivers, under "All England". They aren't in the regional table, and we cover them separately below.
- Change over time. The first official classifications under the revised Bathing Water Directive's tougher standards were for 2015, so 2015 is our starting point. The number of bathing waters has grown since then, from 408 classified in 2015 to 449 now, and many of the new ones are rivers. To compare like with like, the "change" figures use only the 406 sites classified in both 2015 and 2025.
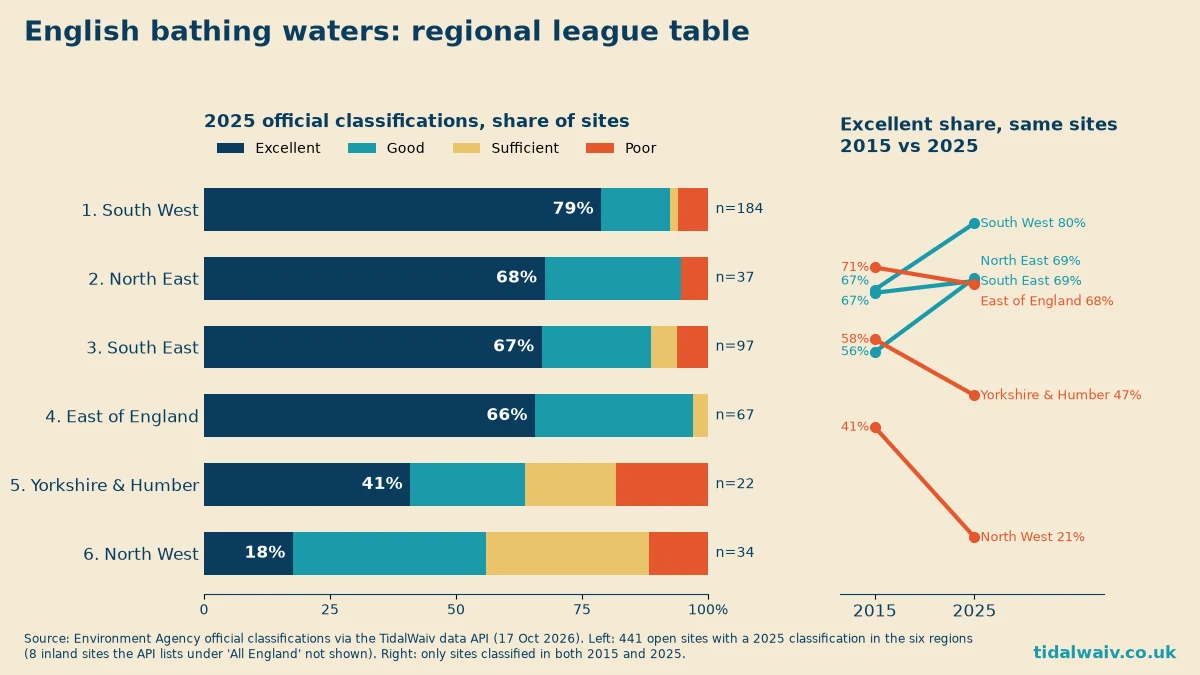
The 2025 league table
1. South West: 79% Excellent (145 of 184)
The South West has by far the most bathing waters, and the highest share rated Excellent. Like for like, it went from 67% Excellent in 2015 to 80% in 2025.
It also has 11 Poor sites, more than any other region. Five of those were designated only recently, including the River Frome at Farleigh Hungerford, the River Tone at French Weir Park and two Dart Estuary sites. The other six include Blue Anchor West, Dunster Beach and three Weston-super-Mare beaches.
2. North East: 68% Excellent (25 of 37)
The North East is the most improved region. Like for like, its Excellent share rose from 56% in 2015 to 69% in 2025 (20 to 25 of 36 sites), up 13.9 points against 12.5 for the South West. It has only two Poor sites: Tynemouth Cullercoats, and Littlehaven Beach, which was first classified in 2024.
3. South East: 67% Excellent (65 of 97)
At the 90 sites classified in both years, the Excellent share barely moved, from 67% in 2015 to 69% in 2025. But the South East had no Poor sites in 2015 and has six now. Four were classified in 2015 and rated Good or Sufficient then: Bognor Regis (Aldwick), Dymchurch, Littlestone and Southsea East. The other two are newer designations: the River Avon at Fordingbridge and Worthing Beach House.
4. East of England: 66% Excellent (44 of 67)
The East of England is the only region in the table with no Poor sites, and all but two of its sites are Good or better. Its Excellent share at the same sites has slipped a little, from 71% to 68%.
5. Yorkshire & Humber: 41% Excellent (9 of 22)
Yorkshire & Humber has lost ground. Like for like, its Excellent share fell from 58% to 47%.
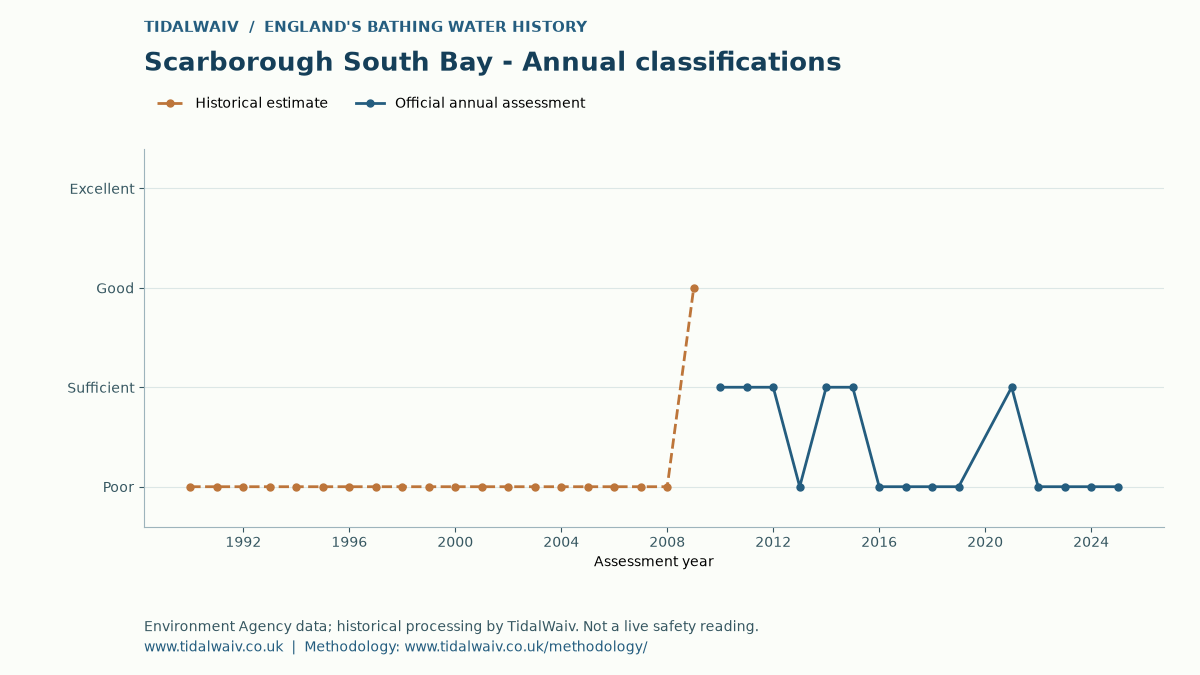
It has four Poor sites. Three are river sites first classified since 2021: the Nidd at Knaresborough and two on the Wharfe at Ilkley. The fourth is Scarborough South Bay, rated Poor every year from 2022 to 2025.
6. North West: 18% Excellent (6 of 34)
The North West is bottom, well behind every other region, and its share is falling. Like for like, its Excellent share halved: 12 of the 29 sites classified in both years were Excellent in 2015 (41%), and 6 in 2025 (21%). Across all sites classified each year, it peaked at 52% Excellent in 2022 before falling to 18%.
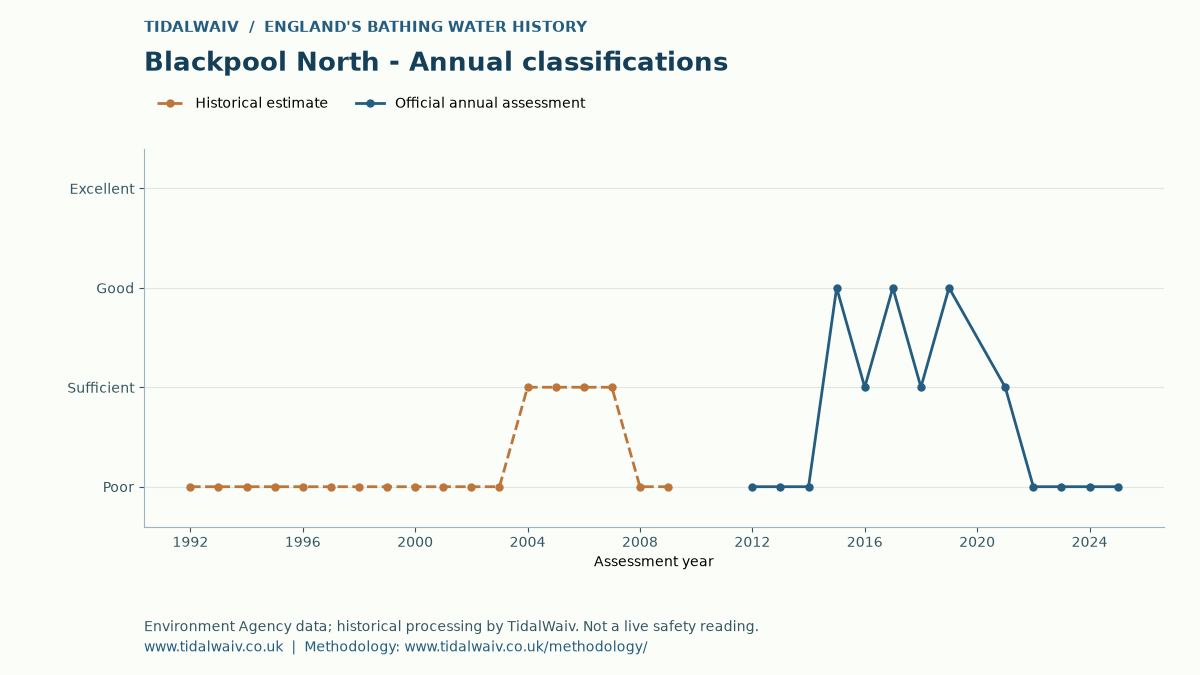
Eleven of its 34 sites are only Sufficient, and four are Poor: Blackpool North, Haverigg, Derwent Water at Crow Park and the River Ribble at Edisford Bridge. Blackpool North has been Poor every year from 2022 to 2025.
Not in the table: inland "All England" sites, 3 of 8 Excellent
The three Excellent sites are lakes: Colwick Country Park (West Lake) and two Rutland Water sites, Sykes Lane and Whitwell Creek. The other five of the eight sites the API lists under "All England" were Poor in 2025: the River Severn at Ironbridge and in Shrewsbury, the River Teme in Ludlow, Sheep's Green on the River Cam and Wolvercote Mill Stream. All five were first classified in 2022 or later.
What changed nationally
At the 406 sites classified in both years, the share rated Excellent rose from 64.5% in 2015 to 69.0% in 2025. Over the same period, the number of Poor sites in that group rose from 6 to 14.
Across all sites classified each year, the national Excellent share peaked at 72.4% in 2019 and was 66% in 2025.
New designations account for much of the rise in Poor ratings. Of the 32 Poor sites in 2025, 18 were first classified after 2015, and most of those are rivers designated in 2024. Rivers face different pressures from coastal waters, so as more river sites join the list, they pull the national figures down even where the coast hasn't changed.
Caveats
- 2015 is the start of the series. 2015 was the first year England was classified under the revised Bathing Water Directive's tougher standards.
- No 2020 ratings. There were no classifications in 2020 because COVID cut sampling.
- Regions differ in size. The South West has 184 sites and Yorkshire & Humber 22, so one site moves Yorkshire's share by about 4.5 points and the South West's by about 0.5.
- New sites change the mix. That's why we give like-for-like figures for change over time.
- A classification looks back four years. Each one is based on four years of samples, so it isn't a live safety reading. For conditions on the day, check the EA's Swimfo before you swim.
- Sources: EA official classifications, retrieved through the TidalWaiv data API on 17 October 2026 (methodology). TidalWaiv is independent and not affiliated with the EA.
You can look up any beach's full history in the TidalWaiv bathing water directory.