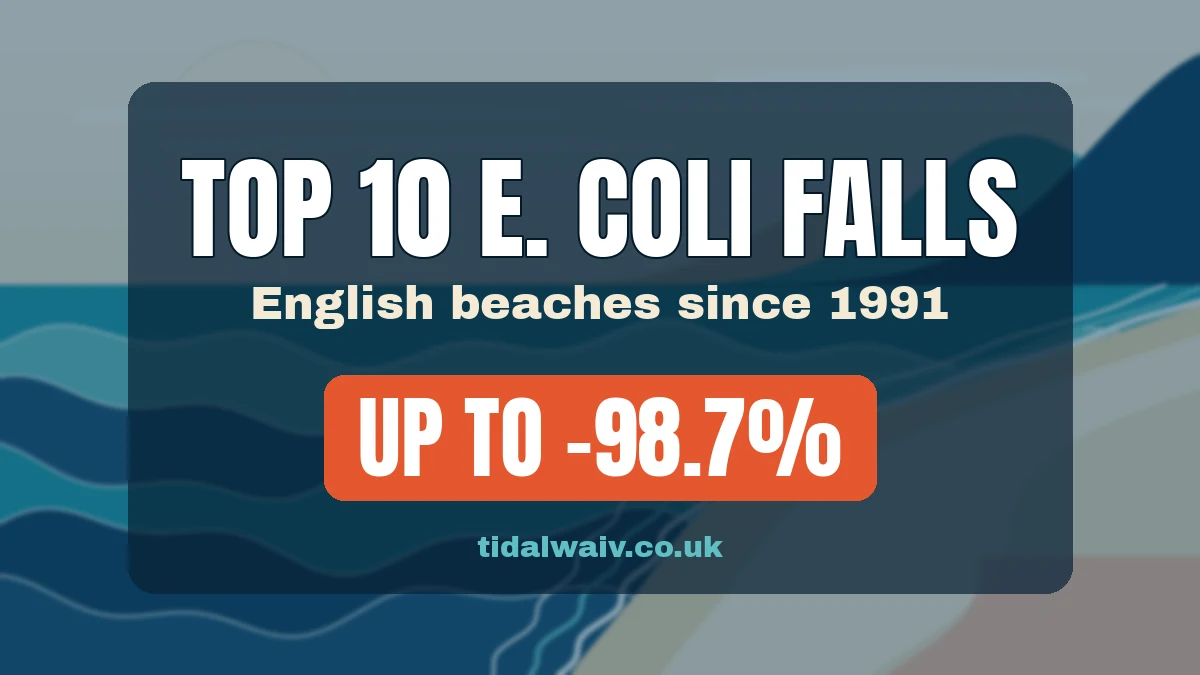
Since 1991, levels of E. coli at some English bathing waters have fallen by more than 90%. This piece looks at the ten largest falls in the TidalWaiv data, what each beach's record shows, and what the ranking can and can't tell you.
What the ranking measures
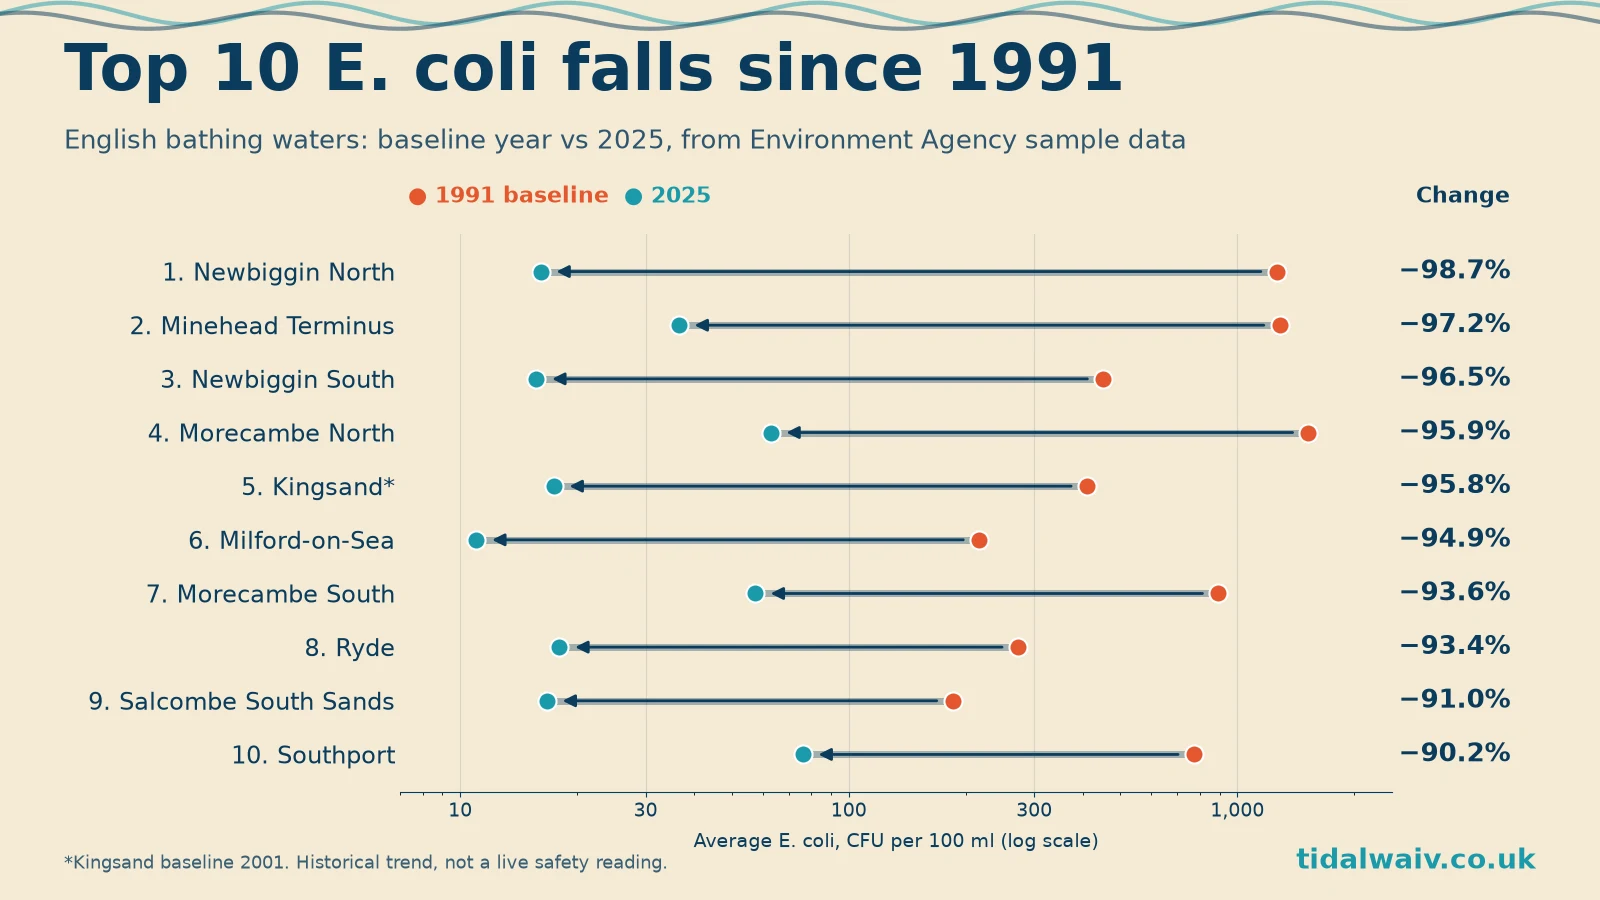
E. coli is one of the two bacteria the Environment Agency (EA) uses to assess bathing water. It reacts quickly to fresh sewage and animal waste. The ranking compares an average E. coli level, in colony-forming units per 100 ml (CFU/100ml), for a baseline year with the same measure for 2025. It is taken from TidalWaiv's published top 10 table, which ranks bathing waters by percentage fall.
A few points shape the list:
- The averages are smoothed. TidalWaiv builds four-year rolling averages from the EA sample record, so one bad summer or one clean summer doesn't dominate. The methodology page explains how.
- Most baselines are 1991. Most of these records start in 1988, so 1991 is the first year with four seasons of samples behind it. Kingsand's record starts in 1998, so its baseline is 2001.
- It ranks percentage change, not current quality. A beach that started very high can fall a long way and still be rated only Sufficient today. Three of these ten were rated Sufficient in 2025.
- It uses E. coli only. The TidalWaiv beach pages show a combined trend that uses both E. coli and intestinal enterococci, so their percentages differ slightly from the ones here.
The ten beaches
1. Newbiggin North, Northumberland: 98.7% lower
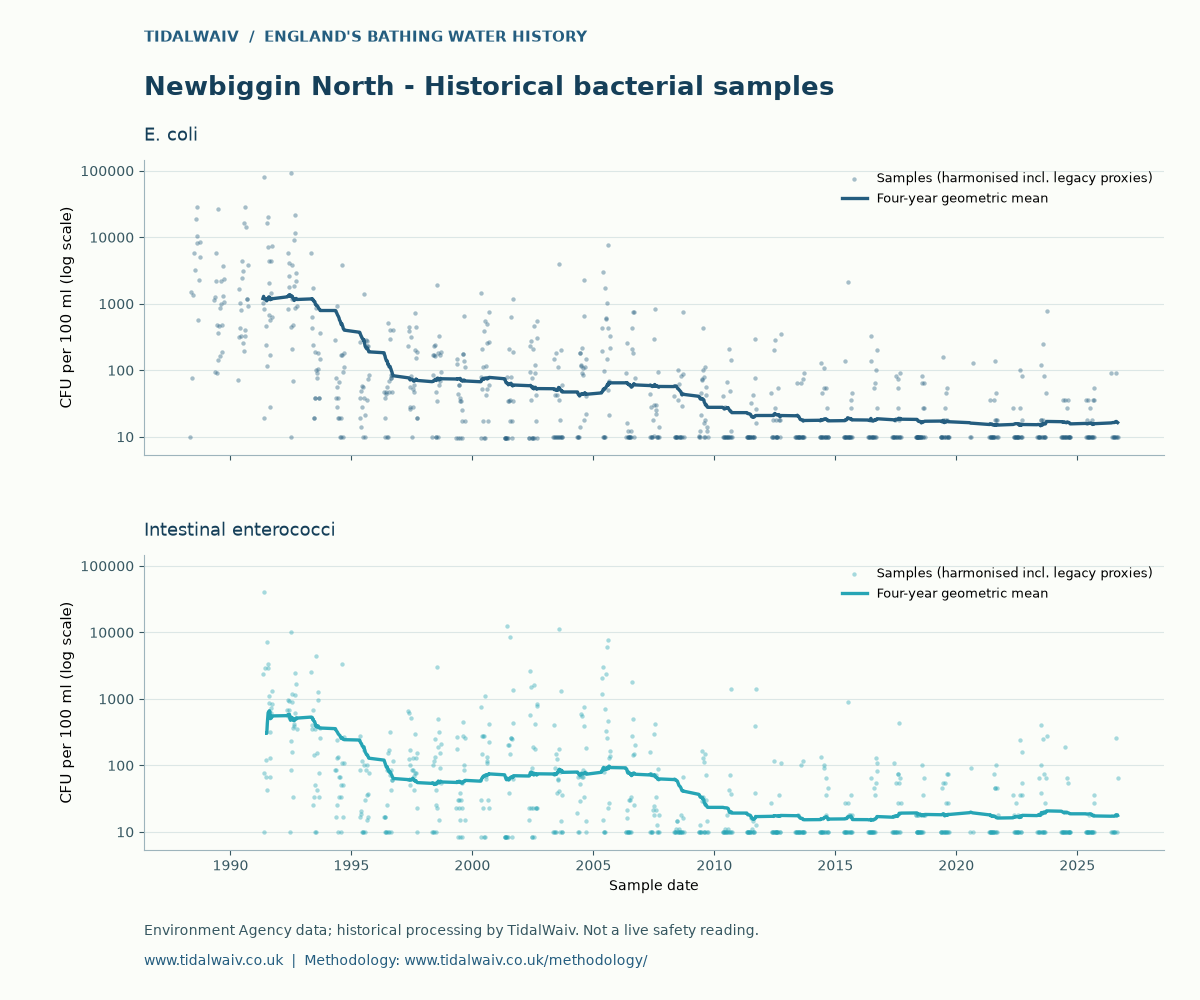
Average E. coli fell from 1,262.1 CFU/100ml in 1991 to 16.1 in 2025. The EA rated it Excellent in nine of the eleven assessed years from 2014 to 2025, and Good in the other two (2017 and 2023). Its record runs to 774 samples since 1988. Beach page
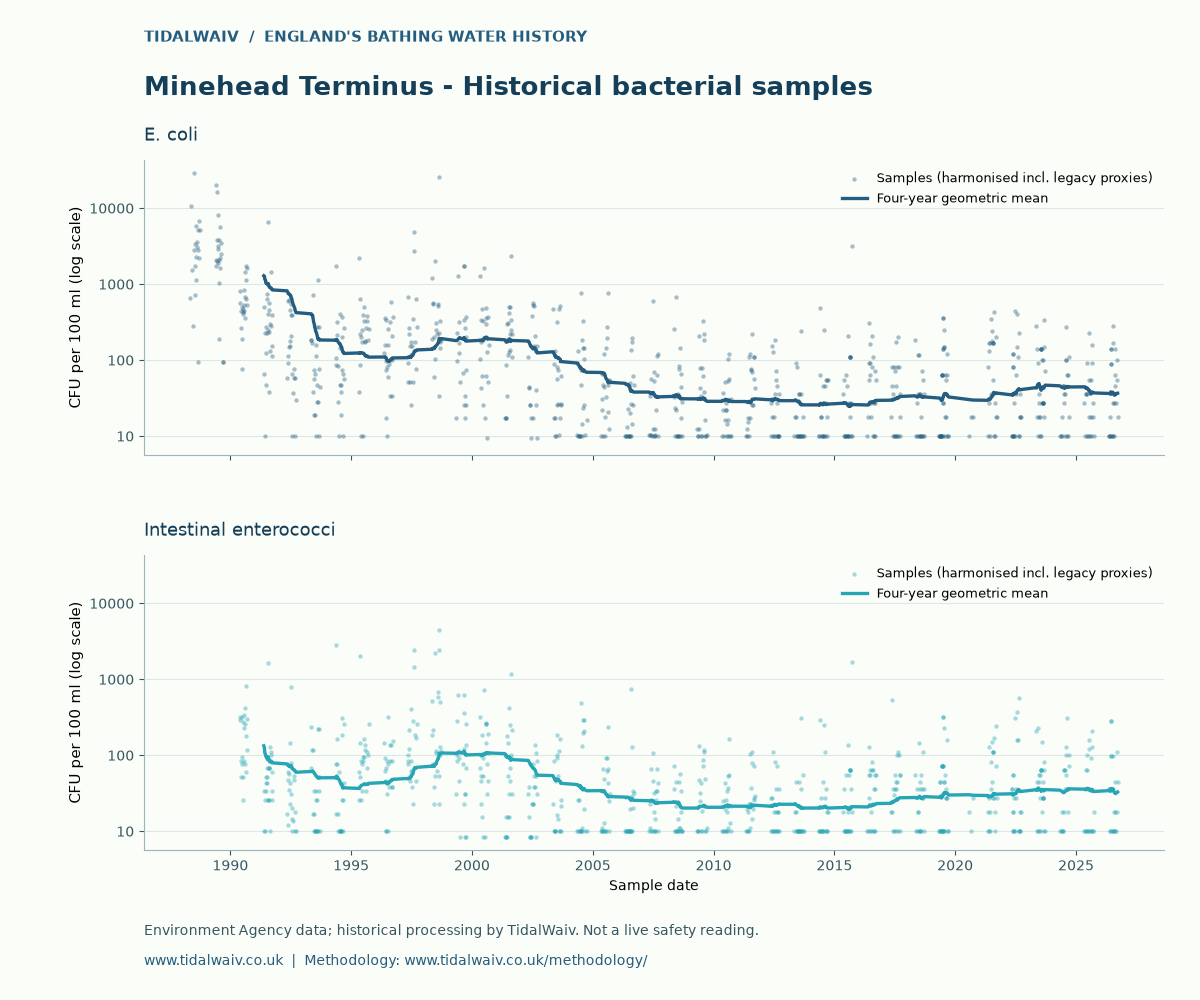
2. Minehead Terminus, Somerset: 97.2% lower
Average E. coli fell from 1,284.3 to 36.5. The long-run fall is large, but the official picture has slipped recently: Good in most years from 2010 to 2022 (Excellent in 2013), then Sufficient in 2023, 2024 and 2025. Beach page
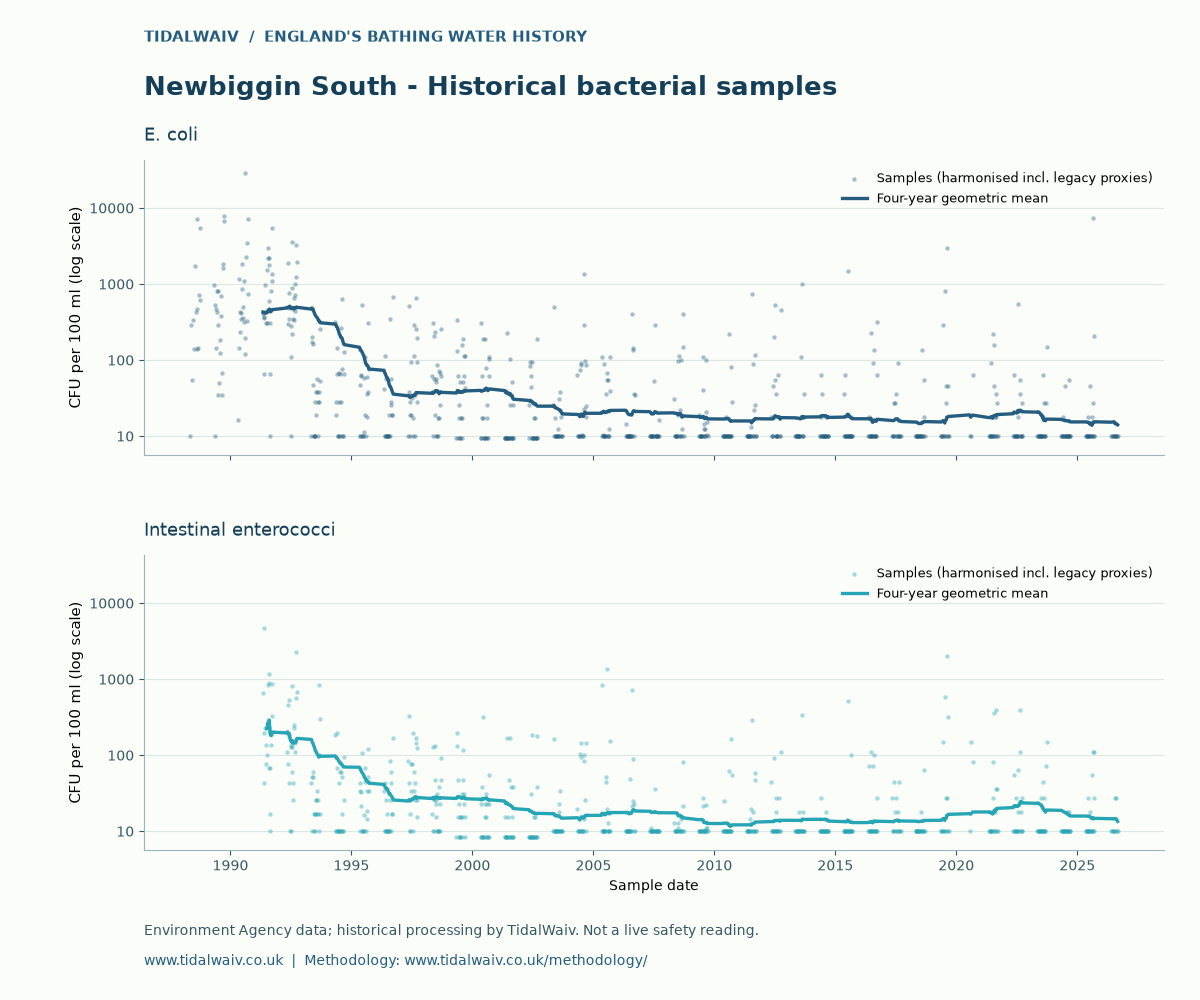
3. Newbiggin South, Northumberland: 96.5% lower
Average E. coli fell from 451.5 to 15.7. It was rated Excellent every year from 2010 to 2018, Good from 2019 to 2023, and Excellent again in 2024 and 2025. Beach page
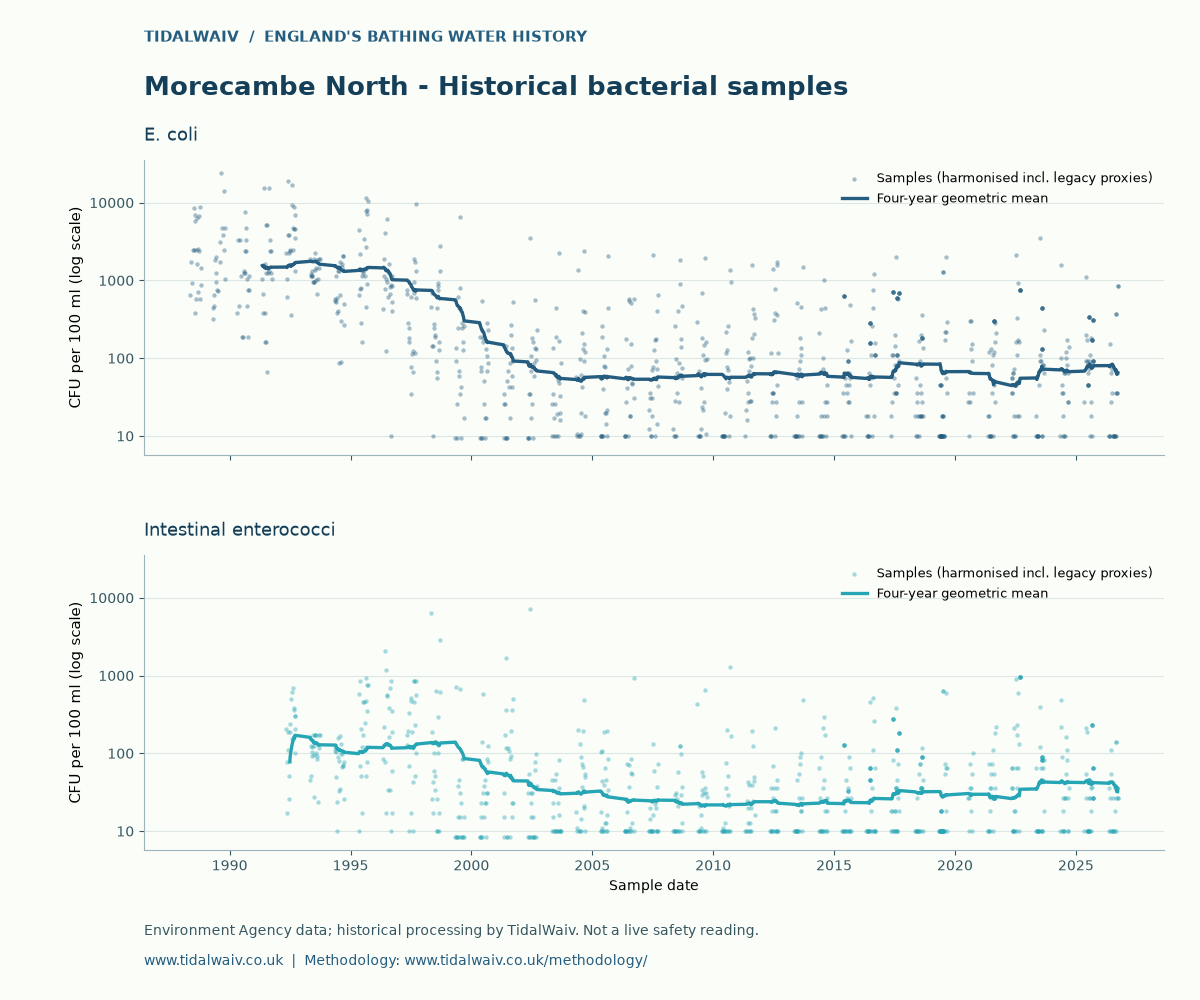
4. Morecambe North, Lancashire: 95.9% lower
Average E. coli fell from 1,523.5 to 62.9, the highest baseline and the largest fall in absolute terms on this list. It was rated Poor in 2011 and 2012 and has been Sufficient every year from 2022 to 2025. Beach page
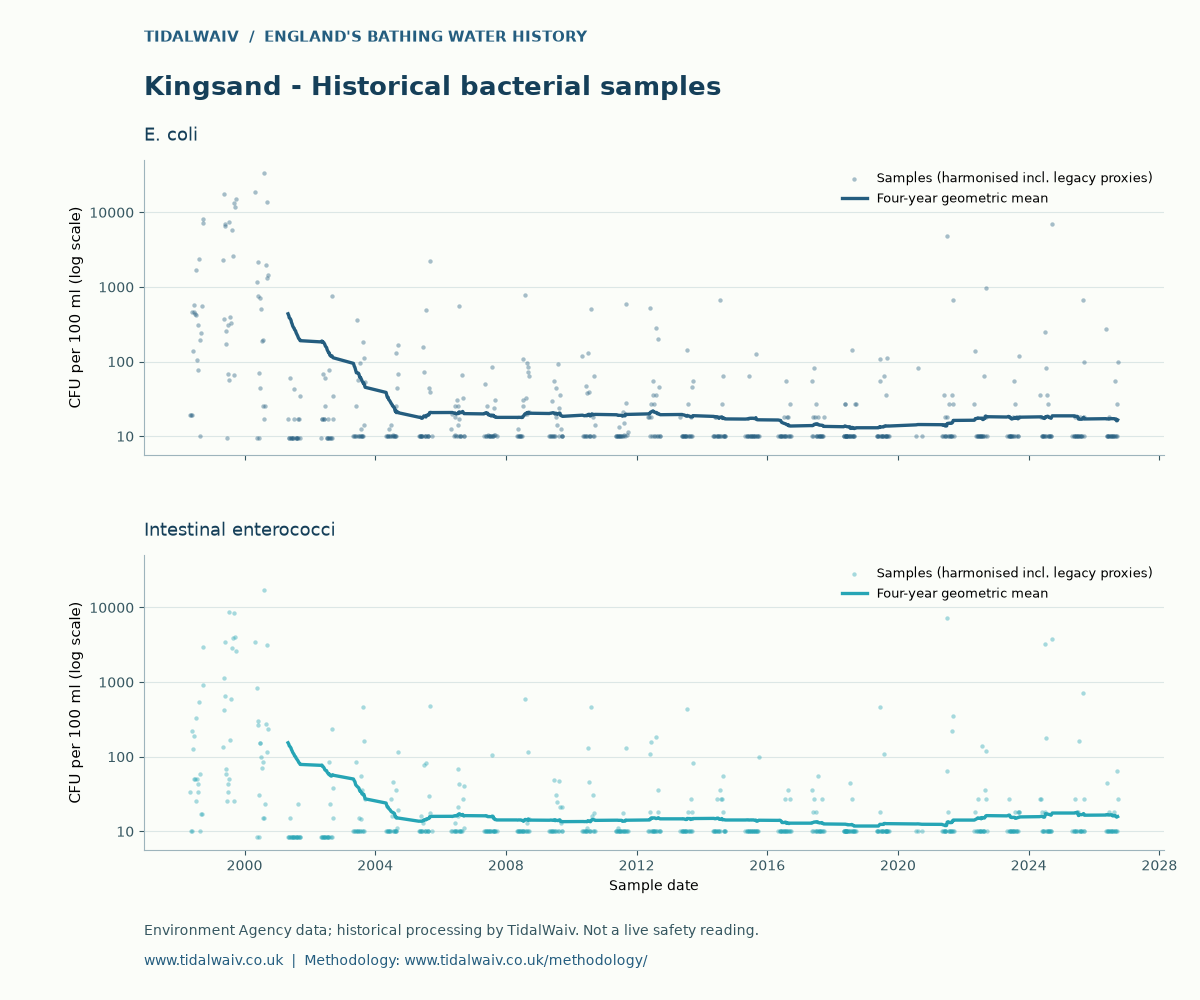
5. Kingsand, Cornwall: 95.8% lower (from 2001)
Average E. coli fell from 410.0 in 2001 to 17.4 in 2025. This is the only beach here with a later baseline, because its sample record starts in 1998. It was rated Excellent every year from 2010 to 2023, then Good in 2024 and 2025. Beach page
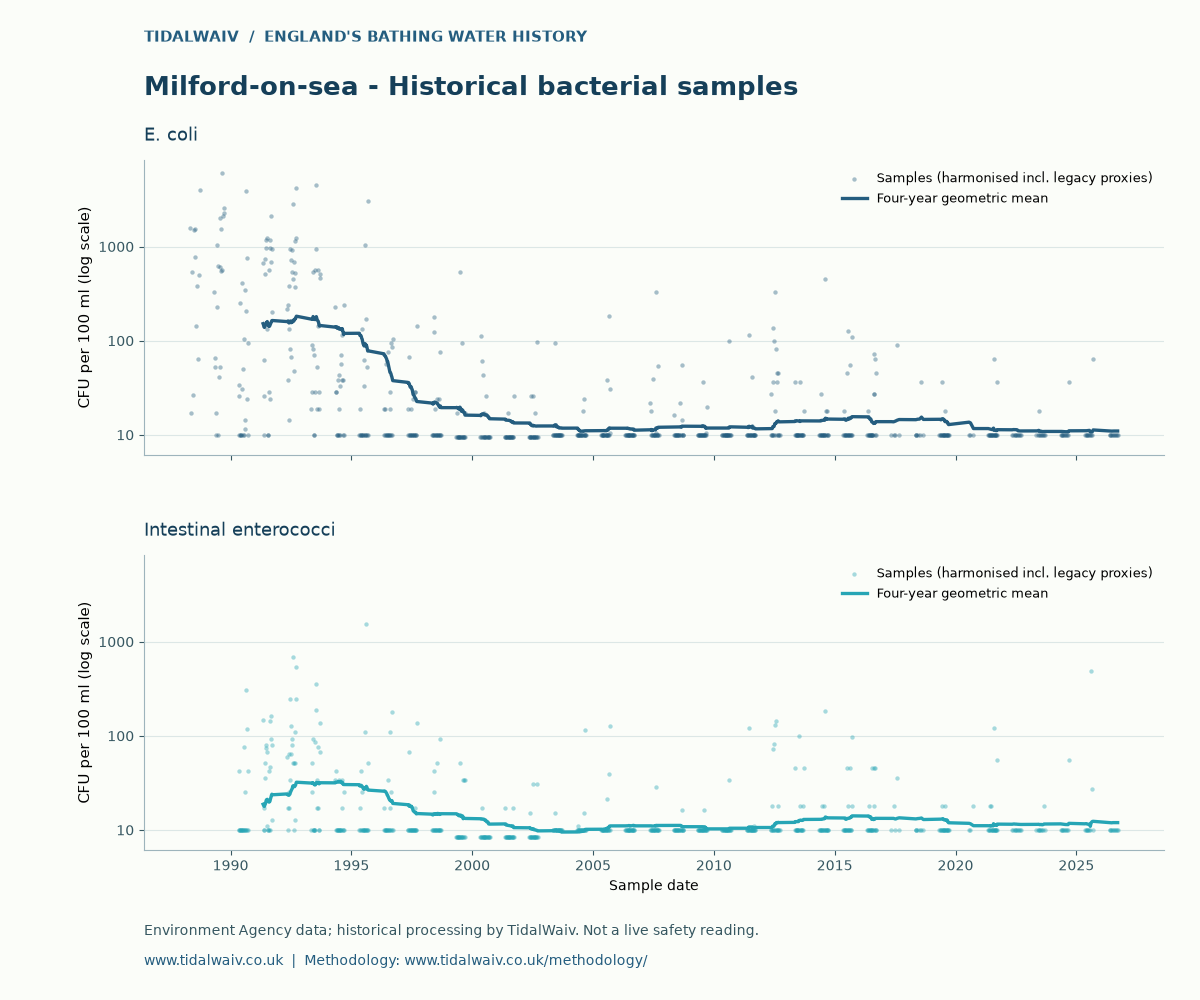
6. Milford-on-Sea, Hampshire: 94.9% lower
Average E. coli fell from 216.4 to 11.0, the lowest 2025 level of the ten. It is the only beach on the list rated Excellent in every official assessment from 2010 to 2025. Beach page
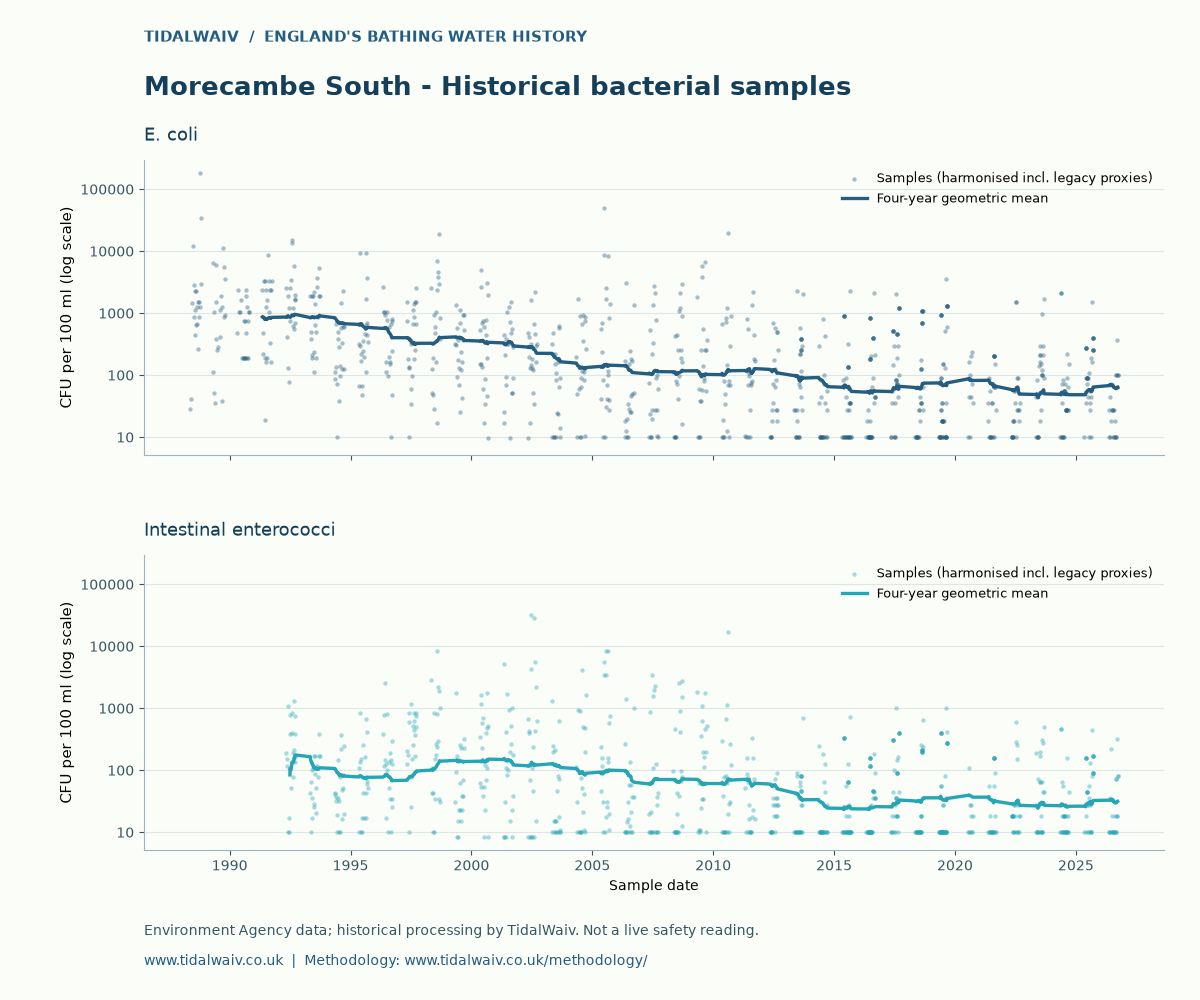
7. Morecambe South, Lancashire: 93.6% lower
Average E. coli fell from 893.0 to 57.3. It was rated Poor every year from 2010 to 2013 and Good in 2024 and 2025. That is a bigger change in official rating than any other beach here. Beach page
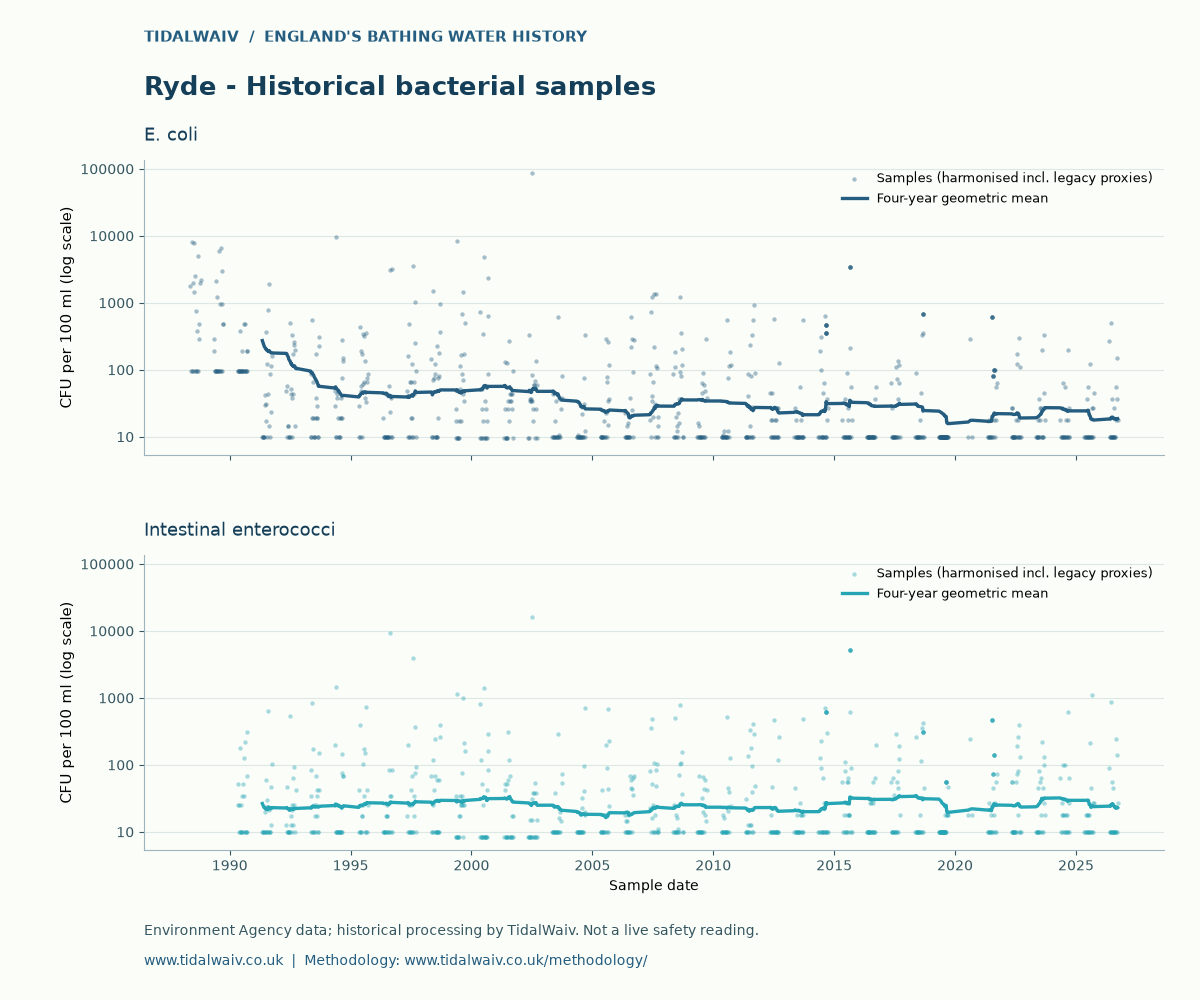
8. Ryde, Isle of Wight: 93.4% lower
Average E. coli fell from 272.3 to 18.0. It was rated Sufficient in 2010 and 2011 and Good in every assessed year since 2012, apart from Excellent in 2021. Beach page
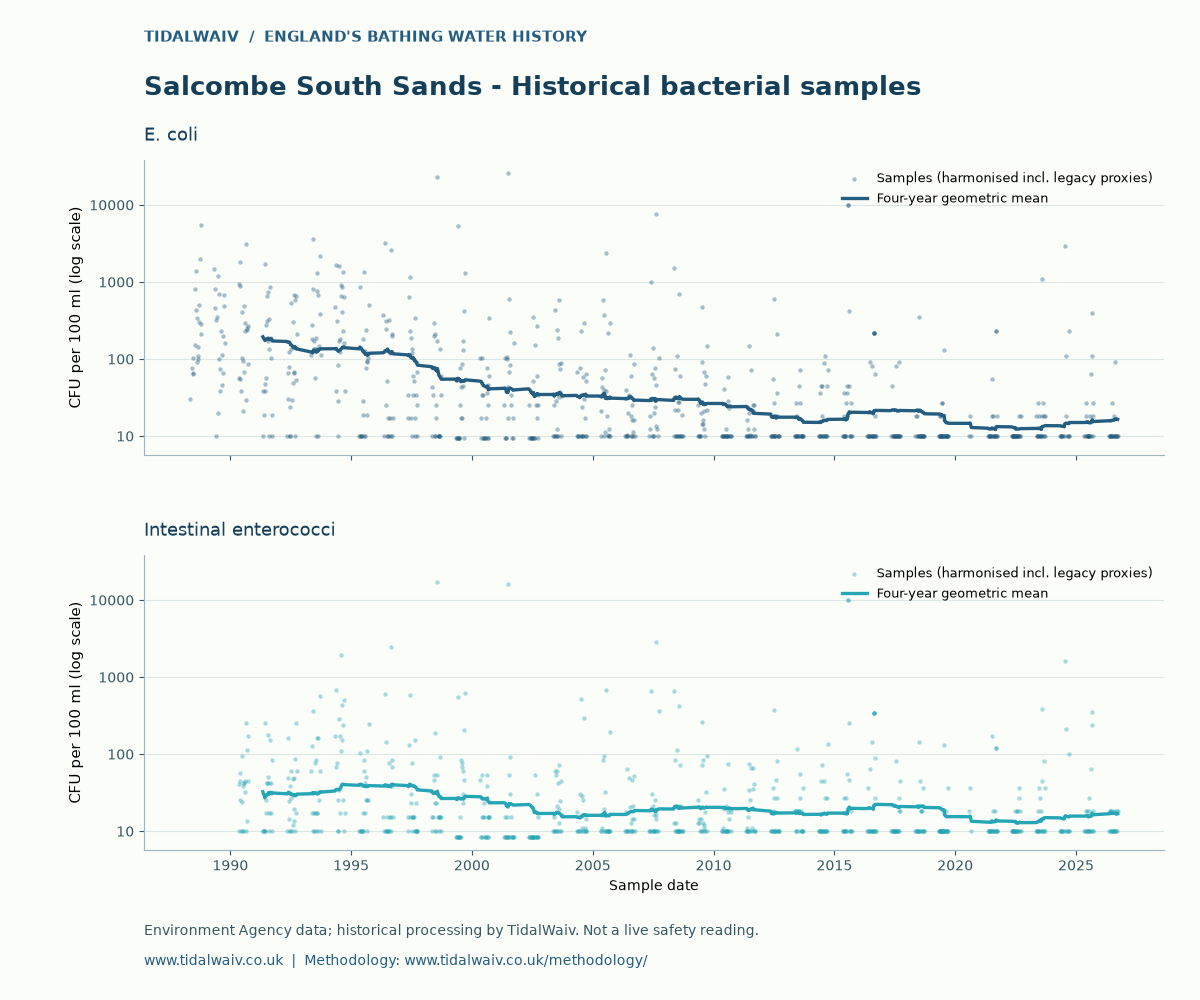
9. Salcombe South Sands, Devon: 91.0% lower
Average E. coli fell from 184.9 to 16.7. It was rated Excellent in every assessed year from 2017 to 2025. Its beach description notes that a stream flows across the beach to the sea. Beach page
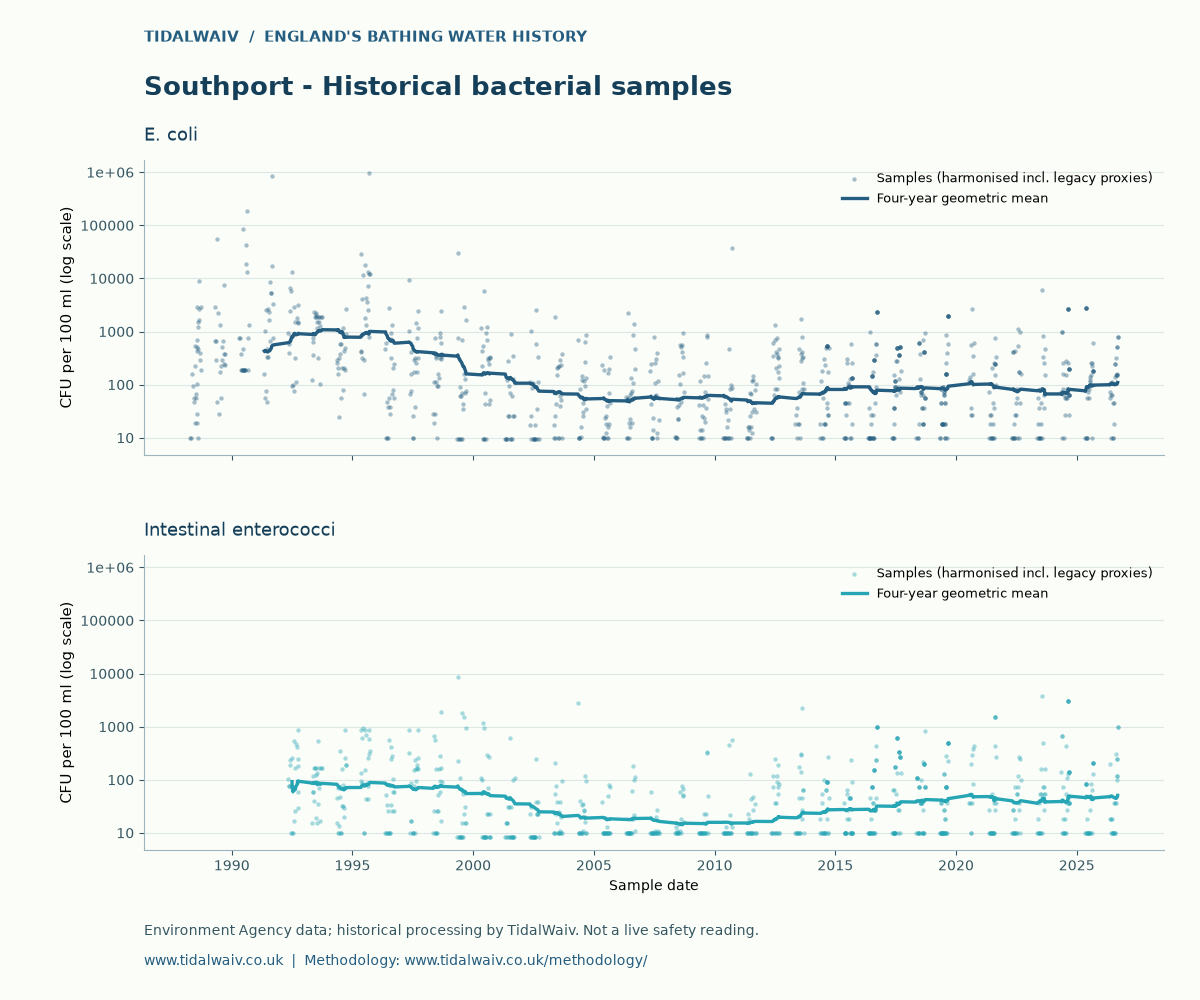
10. Southport, Merseyside: 90.2% lower
Average E. coli fell from 772.7 to 76.1, the highest 2025 level of the ten. It was rated Poor in 2010, 2012 and 2013, Good from 2014 to 2021, and Sufficient from 2022 to 2025. Beach page
What the list shows
Every beach on the list has a large long-run fall, but the 2025 official ratings vary. Four were rated Excellent (Newbiggin North, Newbiggin South, Milford-on-Sea and Salcombe South Sands), three Good (Kingsand, Morecambe South and Ryde), and three Sufficient (Minehead Terminus, Morecambe North and Southport). Many of the biggest falls came from beaches that started out very dirty. On the smoothed series, most of the improvement at all ten beaches came before 2010. At Minehead Terminus, Morecambe North and Southport, the 2010 level was actually lower than the 2025 one, which fits with their recent Sufficient ratings.
Methodology and caveats
- Historical assessments are not current safety readings. Every figure here describes past samples and annual assessments. None of them tells you what the water is like today. For current conditions, including short-term pollution warnings during the bathing season, check the EA's Swimfo bathing water profiles before you swim.
- Official ratings and estimates are different things. The ratings quoted above are official EA assessments, which run from 2010 under the revised Bathing Water Directive. There were no assessments in 2020 because of COVID. TidalWaiv's beach pages also show earlier years, but those are estimates simulated from sample data, not EA results.
- The early data is converted. Before the late 1990s, most samples were tested for faecal coliforms rather than E. coli. TidalWaiv converts those counts to an E. coli equivalent (0.95 × faecal coliforms) and sets older values below 10 CFU/100ml to 10, which matches the modern detection limit. So the 1991 figures are harmonised estimates, not like-for-like lab results.
- Low figures sit near the floor. Modern methods don't report counts below 10 CFU/100ml. Levels in the teens are already close to the lowest value the data can show, so small differences at the bottom of the table shouldn't be over-read.
- One bacterium only. Official ratings use both E. coli and intestinal enterococci. A beach can do well on one and less well on the other.
- Selection. The table is TidalWaiv's top ten by percentage fall. It doesn't show beaches where levels stayed the same or rose.
Sources: Environment Agency bathing water data for England (Swimfo, bathing water quality statistics), with historical processing by TidalWaiv. Figures were checked against the TidalWaiv data API on 17 October 2026. TidalWaiv is independent and not affiliated with the Environment Agency.